
![]()
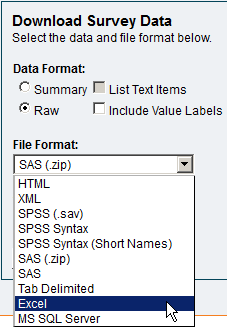
The Data Download tab of the survey page enables you to download survey data in a variety of formats. Note, however, that downloading data from the survey page means downloading all of the data that your survey has collected. If you want to download only a subset of the data returned by a query, see Downloading Results.
To download data:
A number of different file formats are available. SPSS and SAS data can be viewed in the raw data format only. Summary data are not available for SPSS and SAS. Data can be downloaded raw or summary data in Excel, HTML, Tab Delimited text, or XML.
HTML - This is suitable for formatted display in most current browsers, including Internet Explorer and Mozilla
Firefox.
XML - This is suitable for applications that can manipulate XML.
SPSS (.sav) - This format will import the scale code and label for questions with text datatype/scale codes. There is no limit to the length of the scale code. The maximum length of text data is 32767.
SPSS Syntax - This is suitable for import into newer versions of SPSS.
SPSS (Short Names) - This is suitable for import into newer or older versions of SPSS.
SAS (zip) - The ZIP file contains a syntax or program file and a separate data files. Contains all the features outlined in the SAS download section. The separate data file allows text data to be as long as 32760 characters. The data file is encoded using UTF-8 (Unicode) so non-ASCII chars are preserved.
SAS (raw data only) - This is suitable for import into SAS.
Double quote values (“) are preserved in text values.
The pipe character (|) is replaced by an asterisk (*) in text values.
Have output formats for date (DATE9), time (TIME8), and date/time (DATETIME18) data types. Without an output format, these values display as a numeric value which is not very human readable.
The text “informat” length is calculated and based on the maximum length contained in the data set for each specific text property.
Text data is truncated at 958 characters.
Tab Delimited - This is suitable for unformatted viewing in Microsoft Excel or in any text editor. In addition,
many SQL databases will import data from tab-delimited text files.
Excel - This is suitable for formatted display in Microsoft Excel.
MS SQL - This produces a SQL script that will
Create the necessary tables in SQL server
Insert data into the tables.
The SPSS (Short Names) format limits all variable names to eight characters, to comply with naming restrictions in older versions of SPSS. The other SPSS format leaves your survey variable names intact, and is compatible with newer versions of SPSS.
If you want to import data into a SQL database other than Microsoft SQL Server, you may download the MS SQL format and run the CREATE TABLE statements in the file. You can then import the data by removing or replacing the GO statements, or by downloading the tab-delimited data and import that into the newly created database tables.
The summary data format displays the aggregate values that can be calculated from the participant data (Count, Percent, Max, Min, Mean, etc). With summary data it is easy to see the breakdown of responses for a particular question. With questions that allow for free-form text responses, such as comments, aggregate values cannot be calculated. Only the number of the responses can be calculated. If you would like to view text-items in a list instead of viewing only the number of responses to this type of question, choose the "list text items" option. This will provide an overall report that includes summary data for questions with scale values and raw data for text-entry questions. Please note, if there are a large number of responses, there may be a long list of comments in the report.
The raw data format displays questions in a large table. This is your standard spreadsheet layout where each column is a question, and each row is a participant's response. Each cell of the table is a participant's response to a particular question. If you plan to run your own reports, download the raw data and import them into your favorite statistical package.
SAS and SPSS download formats may include only raw data. The options to List Text Items and Include Value Labels do not apply to these formats. Because these formats can only include raw data, the text items are always part of the download. In addition, the downloads include not only the data, but a data dictionary SAS and SPSS automatically import. This means that the value labels always come with the SAS and SPSS downloads and will be present when you import the data into SAS or SPSS. There are 2 different formats to download SAS and 3 formats for SPSS.
Summary results include no useful information about text items. Because text questions are open-ended, permitting an almost unlimited range of responses, Illume does not calculate counts, percentages, or other statistics for these questions.
When you check the List Text Items option, your download will include raw data for each of the text questions in your survey. For example, if 100 participants typed in their first names, the download will include all 100 first names.
The Include Value Labels option adds value labels next to the value codes in the data you download. For example, a question called GENDER may have two response options: 1 = Male and 2 = Female. When you download the raw data, the GENDER column will be a list of 1's and 2's.
When you check Include Value Labels, each entry in the GENDER column will be either 1:Male or 2:Female.
This option makes the data more readable to humans, but it hinders applications such as Excel from processing the data in a purely numeric way.
The Include Value Labels option applies only to Raw data in formats other than SAS and SPSS.
When a survey is stopped and restarted, there is an option to create a new time period. Time periods allow a convenient way to group participant responses and query the data.
The General tab of the Survey page displays the response rate and history for a single time period. By default, this is the current or most recent time period. To display the response history for another time period, simply choose the desired period from the Time Period list.
When downloading data, you have the option to download all the survey data or only data belonging to a specific time period. By default, the time period is set to the current or most recent time period. You may download data for any time period by selected the period under the Data Download tab. See Downloading Data for details.
Downloading Data